Plot your first waveform
Goal
In this tutorial you will learn how to create a waveform widget from the BEC CLI, configure it to plot bpm4i vs samx, and observe live data while running a scan from the CLI.
Before you start
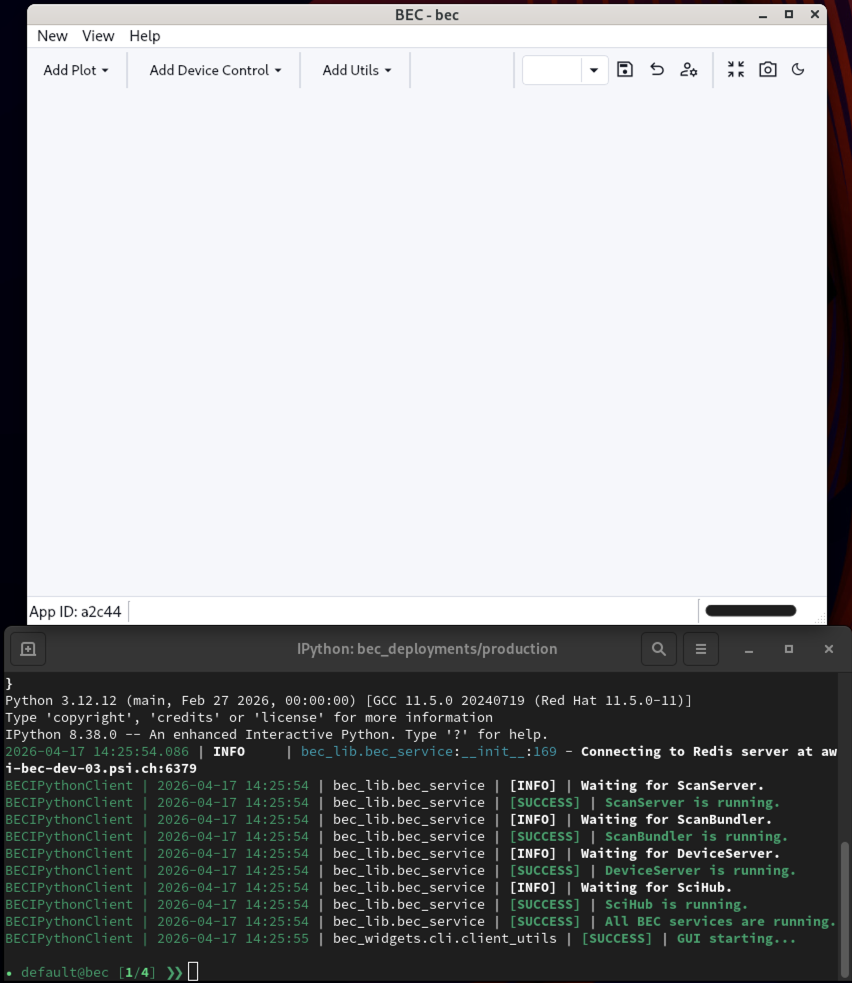
We will use the BEC launcher to start the BEC Ipython together with a Dock Area window. Please choose Terminal + Dock
from the BEC launcher 01 Open BEC.
You should now have a BEC IPython session running, and a Dock Area window open.
Note
For the following we assume that you have a config loaded in your BEC session that contains the samx and bpm4i devices. This is covered in the 02 Load Your First Config tutorial.
1. Inspect the startup GUI objects
The BEC startup gives you a gui object. The default Dock Area opened by Terminal + Dock is available as gui.bec.
gui.bec
2. Available widgets
The gui object has an available_widgets attribute that lists all the widget types you can create from the CLI.
This will print a table of widget classes available programmatically, including the waveform widget we will use in this tutorial.
gui.available_widgets
                                                Available widgets for BEC CLI usage
┏━━━━━━━━━━━━━━━━━━━━━━━┳━━━━━━━━━━━━━━━━━━━━━━━━━━━━━━━━━━━━━━━━━━━━━━━━━━━━━━━━━━━━━━━━━━━━━━━━━━━━━━━━━━━━━━━━━━━━━━━━━━━━━━━┓
┃ Widget Name           ┃ Description                                                                                           ┃
┡━━━━━━━━━━━━━━━━━━━━━━━╇━━━━━━━━━━━━━━━━━━━━━━━━━━━━━━━━━━━━━━━━━━━━━━━━━━━━━━━━━━━━━━━━━━━━━━━━━━━━━━━━━━━━━━━━━━━━━━━━━━━━━━━┩
│ BECMainWindow         │ No description available                                                                              │
│ BECProgressBar        │ A custom progress bar with smooth transitions. The displayed text can be customized using a template. │
│ BECQueue              │ Widget to display the BEC queue.                                                                      │
│ BECShell              │ A WebConsole pre-configured to run the BEC shell.                                                     │
│ BECStatusBox          │ An autonomous widget to display the status of BEC services.                                           │
│ DapComboBox           │ The DAPComboBox widget is an extension to the QComboBox with all avaialble DAP model from BEC.        │
│ DeviceBrowser         │ DeviceBrowser is a widget that displays all available devices in the current BEC session.             │
│ Heatmap               │ Heatmap widget for visualizing 2d grid data with color mapping for the z-axis.                        │
│ Image                 │ Image widget for displaying 2D data.                                                                  │
│ LogPanel              │ Displays a log panel                                                                                  │
│ Minesweeper           │ No description available                                                                              │
│ MonacoWidget          │ A simple Monaco editor widget                                                                         │
│ MotorMap              │ Motor map widget for plotting motor positions in 2D including a trace of the last points.             │
│ MultiWaveform         │ MultiWaveform widget for displaying multiple waveforms emitted by a single signal.                    │
│ PdfViewerWidget       │ A widget to display PDF documents with toolbar controls.                                              │
│ PositionIndicator     │ Display a position within a defined range, e.g. motor limits.                                         │
│ PositionerBox         │ Simple Widget to control a positioner in box form                                                     │
│ PositionerBox2D       │ Simple Widget to control two positioners in box form                                                  │
│ PositionerControlLine │ A widget that controls a single device.                                                               │
│ PositionerGroup       │ Simple Widget to control a positioner in box form                                                     │
│ ResumeButton          │ A button that continue scan queue.                                                                    │
│ RingProgressBar       │ No description available                                                                              │
│ SBBMonitor            │ A widget to display the SBB monitor website.                                                          │
│ ScanControl           │ Widget to submit new scans to the queue.                                                              │
│ ScanProgressBar       │ Widget to display a progress bar that is hooked up to the scan progress of a scan.                    │
│ ScatterWaveform       │ No description available                                                                              │
│ SignalLabel           │ No description available                                                                              │
│ TextBox               │ A widget that displays text in plain and HTML format                                                  │
│ Waveform              │ Widget for plotting waveforms.                                                                        │
│ WebConsole            │ A simple widget to display a website                                                                  │
│ WebsiteWidget         │ A simple widget to display a website                                                                  │
└───────────────────────┴───────────────────────────────────────────────────────────────────────────────────────────────────────┘
3. Add a waveform widget
Create a new Waveform directly in the existing bec Dock Area, and assign it to the variable wf:
wf = gui.bec.new(gui.available_widgets.Waveform)
Note
By assigning the created widget to a variable, you can access it directly from there. However, you can also access it through the Dock Area widget tree, in the example above this would be
gui.bec.Waveform
Waveform created in that Dock Area.
4. Configure the waveform
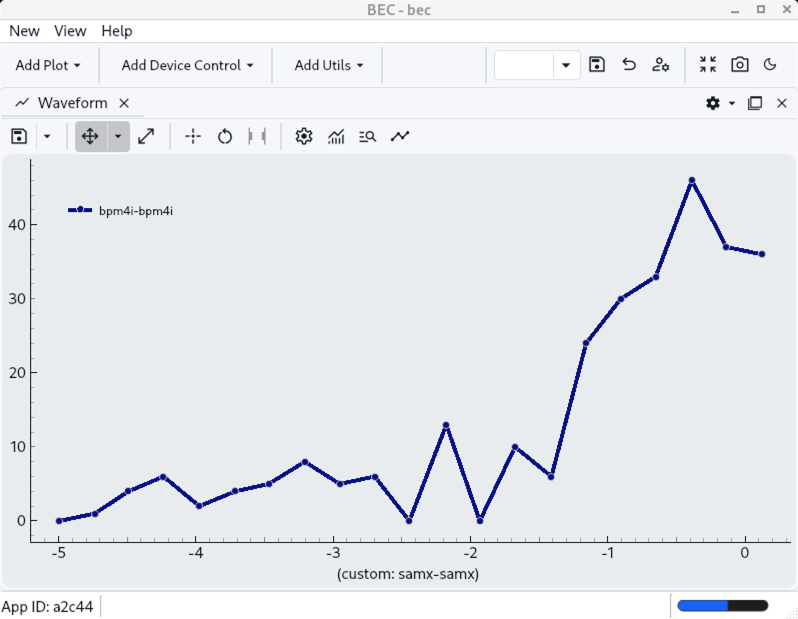
We will now configure the waveform to plot bpm4i against samx.
wf.plot(device_x=dev.samx, device_y=dev.bpm4i)
Note
If you have run scans before, you might already see a curve in the waveform after running the above command. This is because the waveform by default tries to plot historical data if it is available.
5. Run a scan
Now we run a line scan in the CLI and watch the waveform update live with incoming points.
scans.line_scan(dev.samx, -5, 5, steps=10, exp_time=0.1, relative=False)
What you have learned
You used the startup gui object to create a waveform widget from the CLI, and plotted live scan data during a scan.
Next step
Continue with 06 Create Your First GUI if you would like to learn how to use the BEC GUI to create the same workflow with drag-and-drop widgets and no programming.