Create Your First Plot
Goal
In this tutorial you will learn how to plot data collected in a BEC scan.
1. Getting started - open BEC with a GUI interface
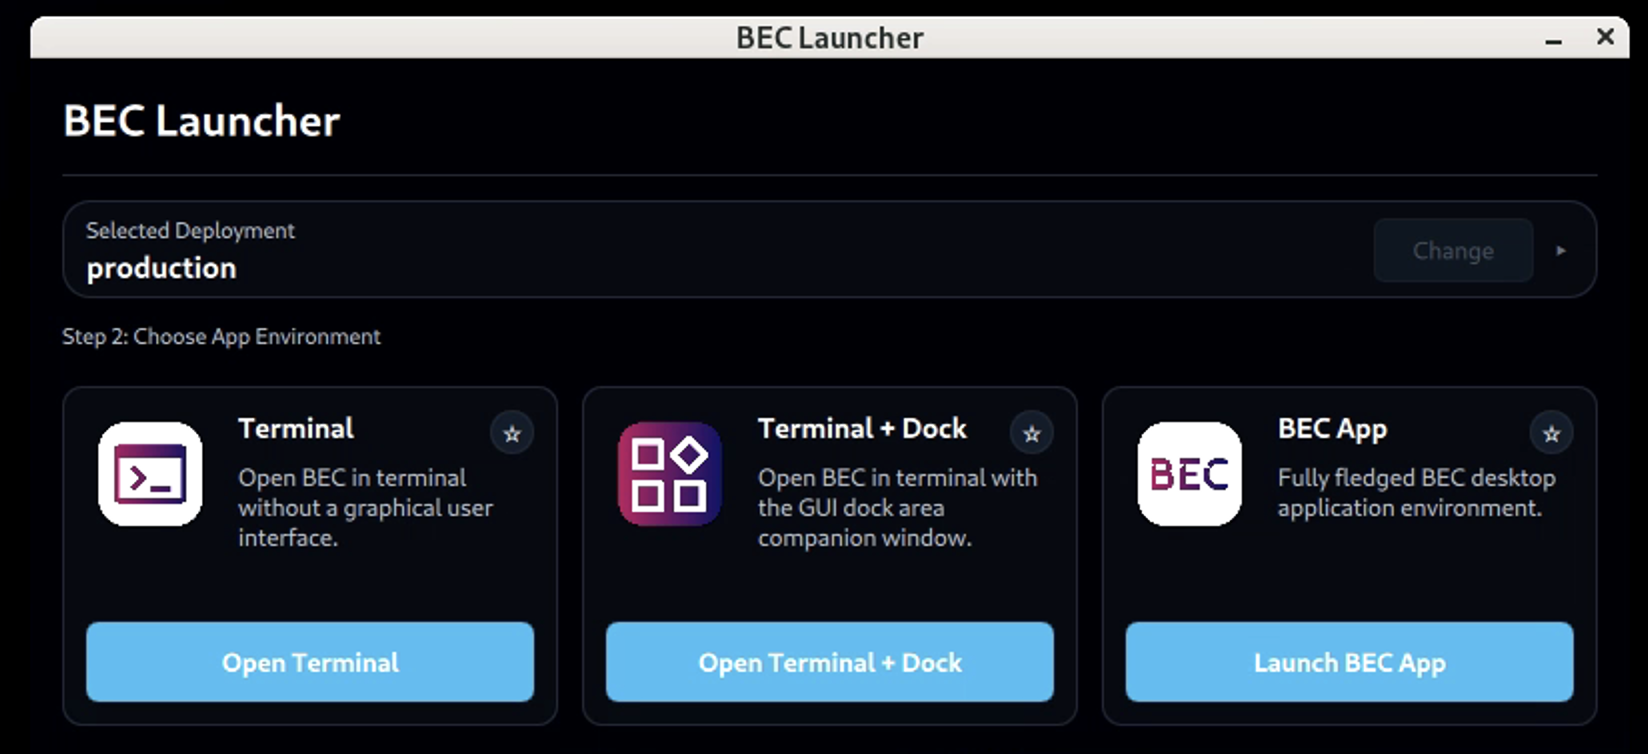
In the BEC launcher (see 01 Open BEC), select the Terminal + Dock interface.
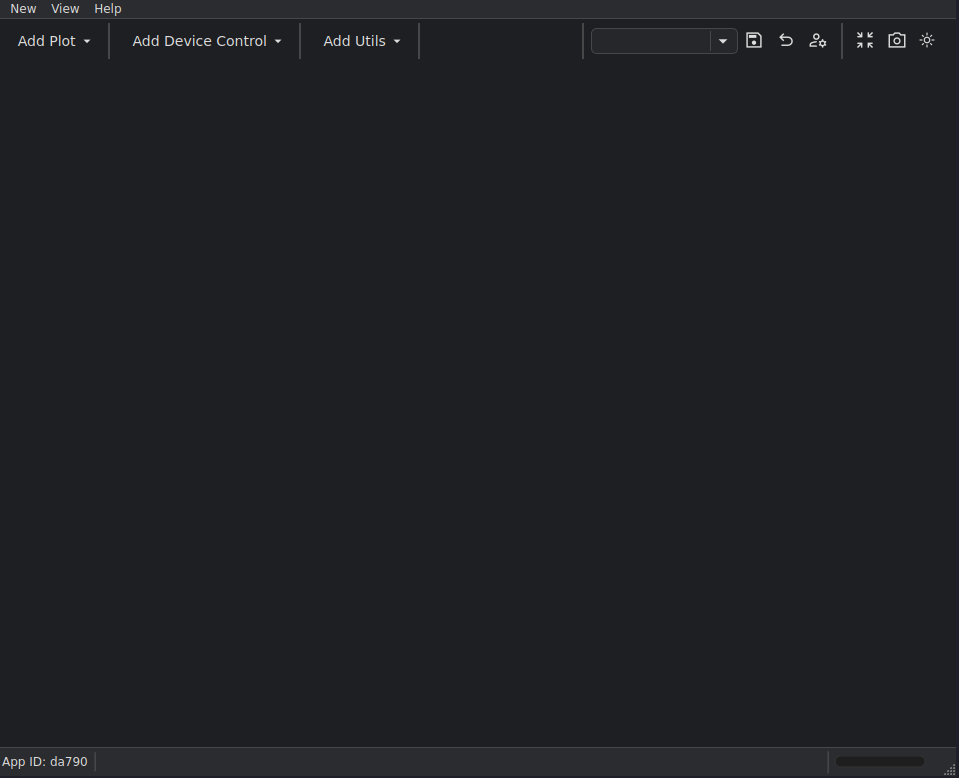
You should be greeted by the same terminal interface from the previous tutorials, and an additional Dock Area GUI window:
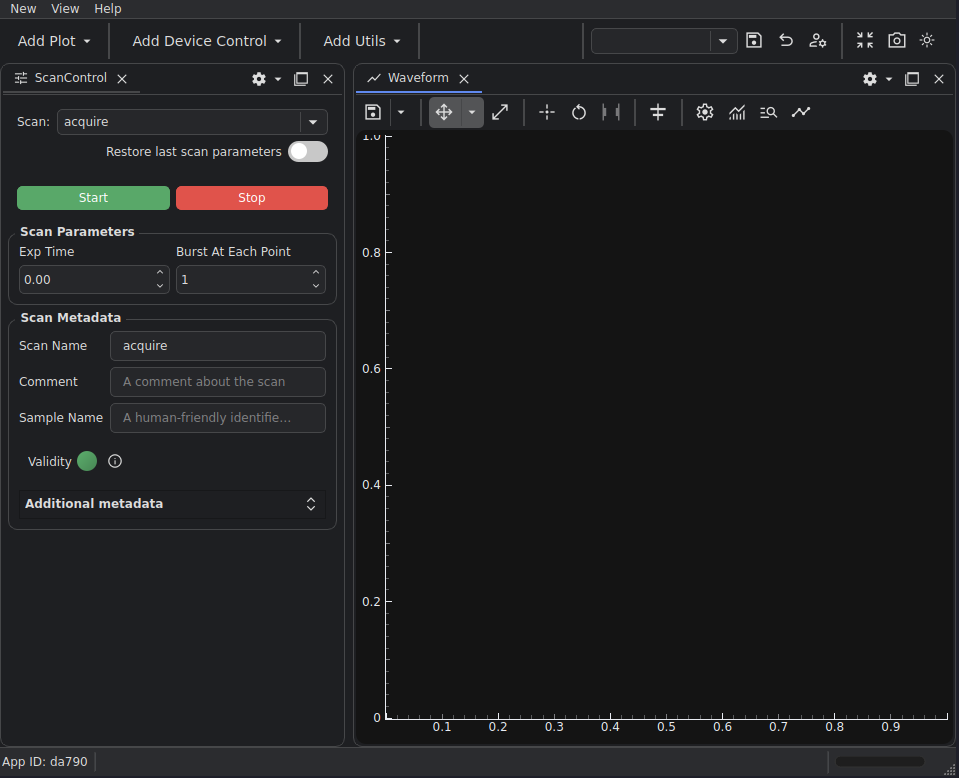
2. Add some widgets
From the Add Device Control menu, select add scan control. Then, from the Add Plot menu, select add waveform.
This should add the two widgets to your Dock Area.
3. Set up your widgets
Fill in similar scan parameters to the scan control widget:
Device: samx
Start: -5
Stop: 5
Steos: 10
Select the devices to display on the plot by clicking on the curve dialog button, changing the X-axis mode to device,
and entering samx. Then for the Y-axis, add a new curve with the + button, and enter bpm3a in the name field.
Close the dialog by clicking the OK button.
4. Run a scan and see the plot
Click on the green Start button in the scan control widget to run the scan and see the plot appear on the waveform
widget.
What you have learned
You have run a scan, the data from which was automatically plotted.
Next step
Continue with Save and Switch Dock Area Profiles to save this layout and switch between different Dock Area profiles.